A look at CAP’s latest report, exploring the link between debt, poverty and living standards.
Pushed under, pushed out
Today is an exciting day because we are launching our long awaited report, Pushed under, pushed out. Over 2023 Christians Against Poverty (CAP) partnered with the Centre for Research in Social Policy (CRSP) at Loughborough University to look into the link between debt, poverty and living standards. Until today, little research had been conducted in this area and we hope this research will provide a useful springboard for future exploration.
Methodology
Pushed under, pushed out uses data from the Wealth and Assets Survey, which is a survey run by the Office for National Statistics every few years. Analysts can use the survey to monitor individuals over a number of years, and this means we can observe people’s financial positions over a period of time. The report looks at how debt; such as debt type, level of debt repayment, debt to income ratio and life events, all play a part in increasing or decreasing the risk of falling below the Minimum Income Standard (MIS). MIS is a measure of living standards developed by the Centre for Research in Social Policy (CRSP) and the Joseph Rowntree Foundation (JRF). You can find out more about MIS here. The reason CAP has adopted MIS as an approach can be explained here in my last blog.
Summary of findings
Some of the findings aligned with CAP’s pre-existing hypotheses, such as, if you have a high level of debt repayment, you are more at risk of falling below MIS. Those experiencing certain life events, such as relationship breakdown, job loss or ill-health, were also at higher risk of falling below MIS.
Other findings went into greater detail, finding that across the board each demographic breakdown experienced a ‘tipping point’, whereby the risk of falling below MIS became increasingly stark. For instance, the risk of falling below MIS increases across the board when debt-to-income ratios reach 20%. Across all household types, when debt-to-income ratios reach 20%, there is a steep increase in the risk of being pushed below MIS.

We also found that certain demographics faced a disproportionately higher risk, particularly lone parents, households with someone living with sickness or disability and those unemployed.
Other demographics, such as working-age couples with children and pensioner couples, showed that a high debt-to-income ratio was associated with a lower risk of falling below MIS. This is perhaps due to having a more stable, and perhaps higher, income.
Debt type
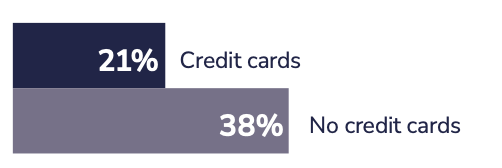
When it came to looking at the type of debt households had, there were some clear, and interesting, results. 82% of those who had fallen behind with bills were at risk of being below MIS, which is high compared to 21% of those with credit cards. What made the findings even more interesting was looking at those who had credit cards, compared with those who did not. It was found that people were at higher risk of falling below MIS without a credit card (38%), compared to those who had one (21%). Now this could be for a number of reasons, such as the availability of this type of mainstream credit products, but it also brings into question whether credit cards play a part in helping smooth income and keep people above MIS.
Overview of risk of being below MIS by debt type
Length of time below MIS
We also found that the households who were persistently below MIS were more likely to have household bill arrears. This wasn’t surprising as generally those on lower incomes are more likely to fall behind with priorities. However, we also found that those who were persistently below MIS were less likely to have a loan or hire purchase agreement. Access to affordable credit is a key issue at present, but this data demonstrates that those on persistently low incomes are unable to afford or access more mainstream credit.
‘So what?’
This question is one we need to ask ourselves regularly, as people working in Policy we can do as much research as we like but without the ‘so what?’ we fall at the last hurdle.
So what if certain demographics are more at risk of falling below MIS?
We must ensure that our policies and processes are not disproportionately impacting people already facing greater risk, and we could go as far as proactively mitigating the harm done to certain demographics.
So what if people on low incomes are not able to access affordable credit?
It is not right, or fair, that low income households have to spend more to access credit as a lifeline. We have lots of thoughts on this, which you can read here. We need to make sure we aren’t perpetuating the poverty premium, that low income families needing a one-off lifeline are able to access it without paying over the odds, and that no one is finding themselves in a position where they need to rely on credit to make ends meet.
So what if high debt repayments push people below MIS?
Creditors and Government must ensure that the debt repayment levels are set at affordable amounts, and that people are given options and flexibility when repaying their debts.
You can read the report and see our full range of policy recommendations.